ReturnLens
Return and COD intelligence for Gulf e-commerce sellers, turning a vague monthly loss number into a ranked, costed action list.
What we set out to build
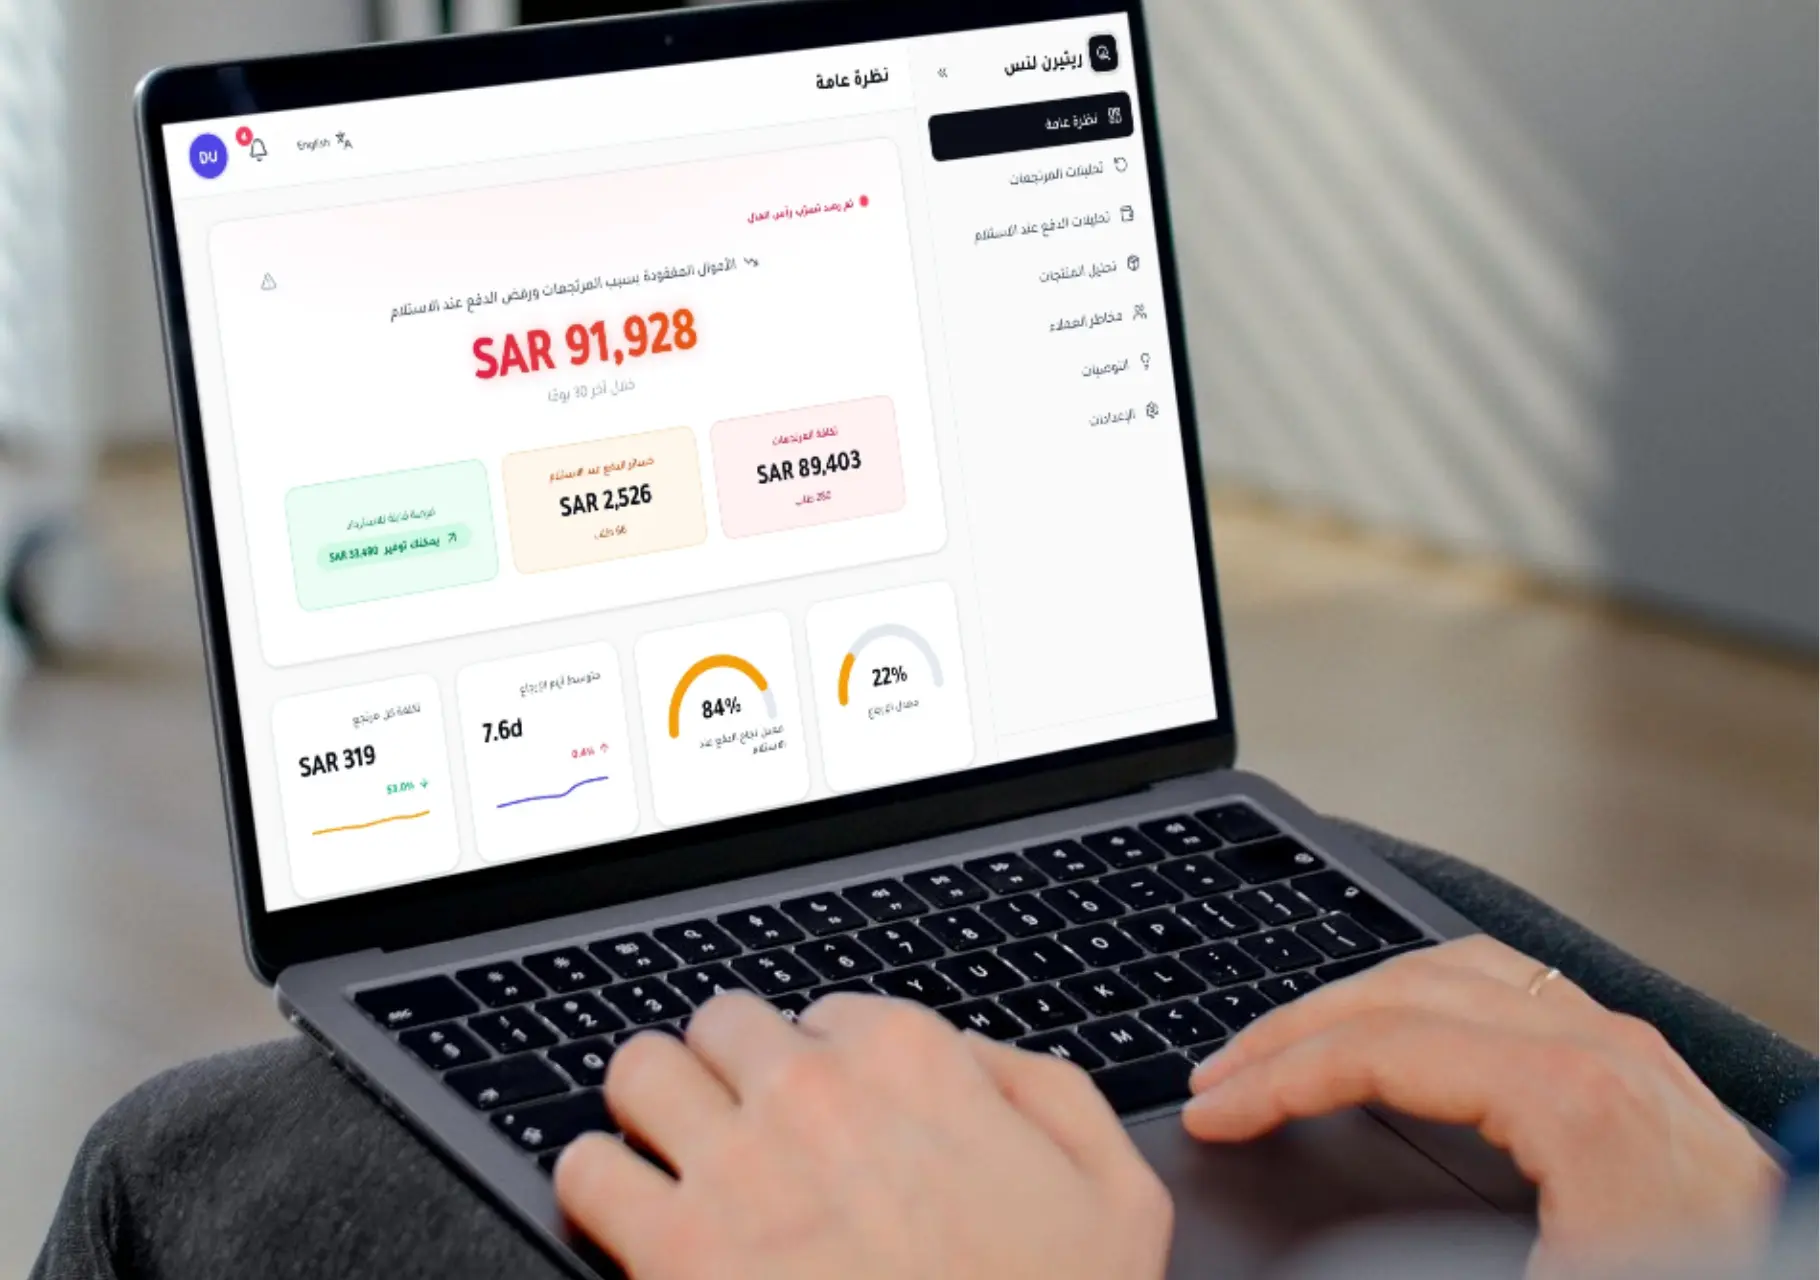
ReturnLens was built to solve a problem almost every Gulf e-commerce seller can feel but can't point to: a monthly loss from returns and failed cash-on-delivery orders that shows up as a single lump sum in the accounting export, with no breakdown of why it happens or who's driving it. It's a self-initiated portfolio build, demoed through a hypothetical persona, Al Waha Retail, a Riyadh-based apparel, footwear, and electronics seller doing 800-3,000 orders a month across Noon, Amazon.ae, and Shopify, running on realistic seeded data rather than a live client's transactions. The dashboard ingests order, return, and COD data, calculates financial loss in real time, breaks it down by city, category, product, and customer, then layers AI on top to turn those patterns into a ranked, costed action list.
Client
Self-Initiated Demo Project
Role
Full Stack Developer
Timeline
4 Weeks, Discovery to Deployment
Services
Product Design, Full-Stack Development, AI Integration, Security Hardening
Challenges & Project Goals
Al Waha had the order volume of a serious retailer but no instrument that translated a vague 'we're losing money' feeling into exactly where the money was going and what to do about it.
Challenges
Goals
Our Approach
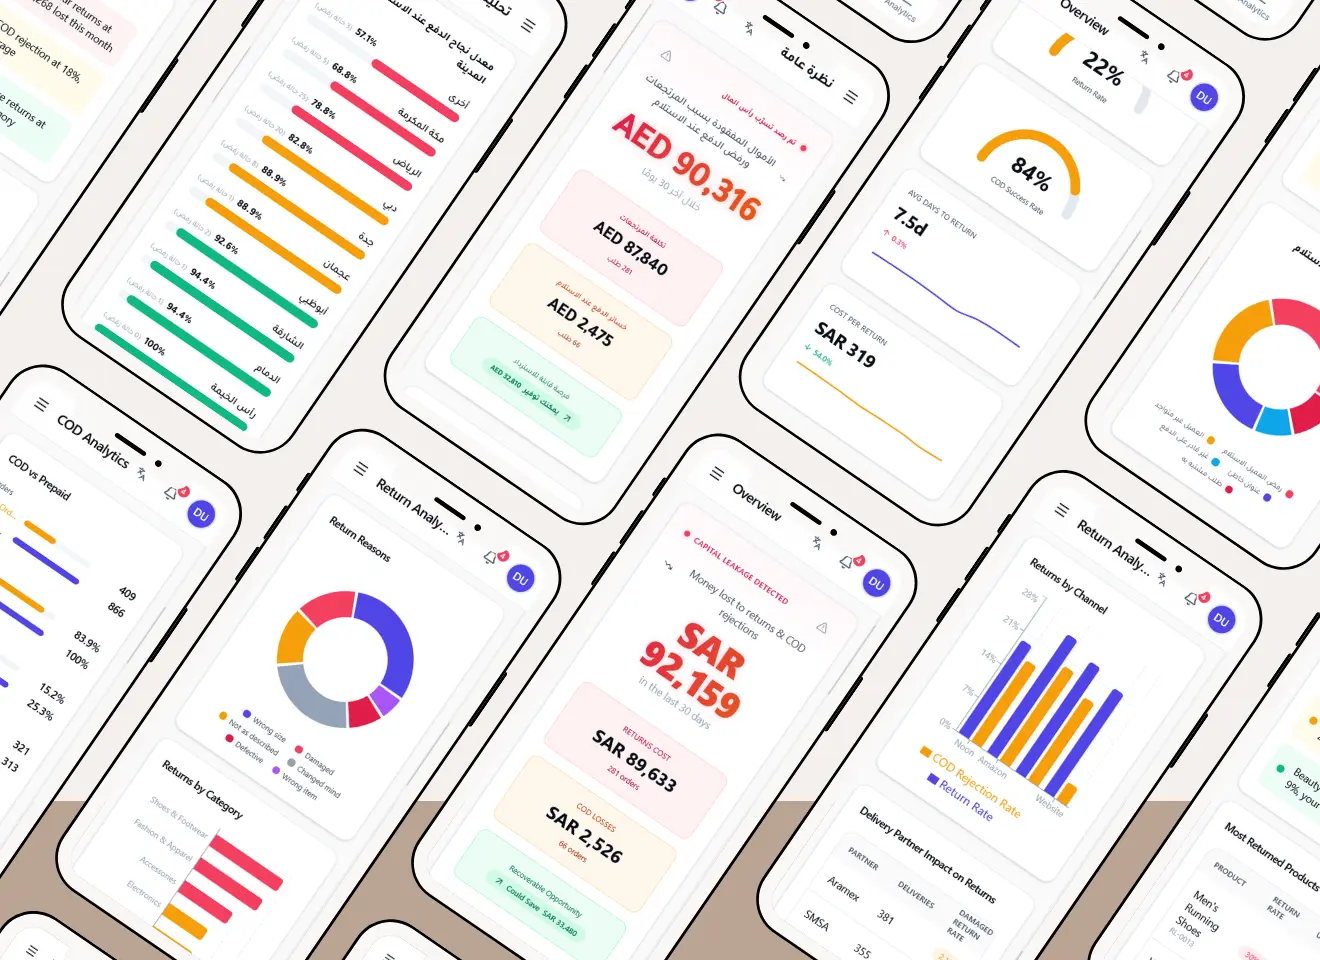
The build was broken into four weekly phases, moving from Gulf-market data modeling to a hardened, production-standard dashboard with AI-generated recommendations on top.
Key Features & Business Value
Every feature ties back to a specific loss driver rather than being built for its own sake.
What It Does & Why It Matters
Money Lost Calculator
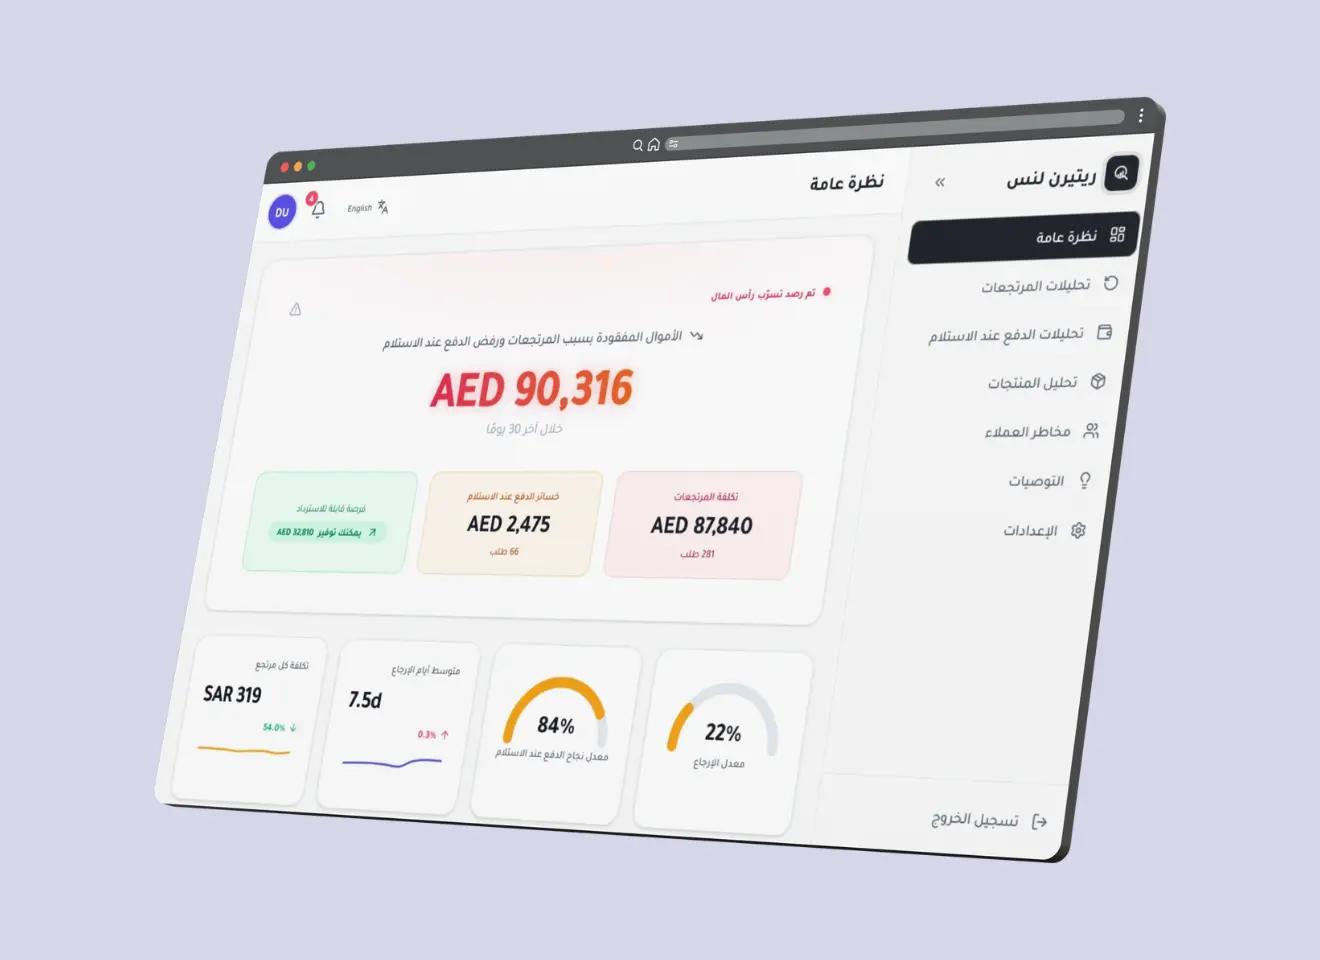
Real-time total loss to returns and COD rejections, split by cause, with a projected recoverable-savings figure, turns a vague monthly accounting hit into a specific number the whole team rallies around.
City-Level COD Analytics
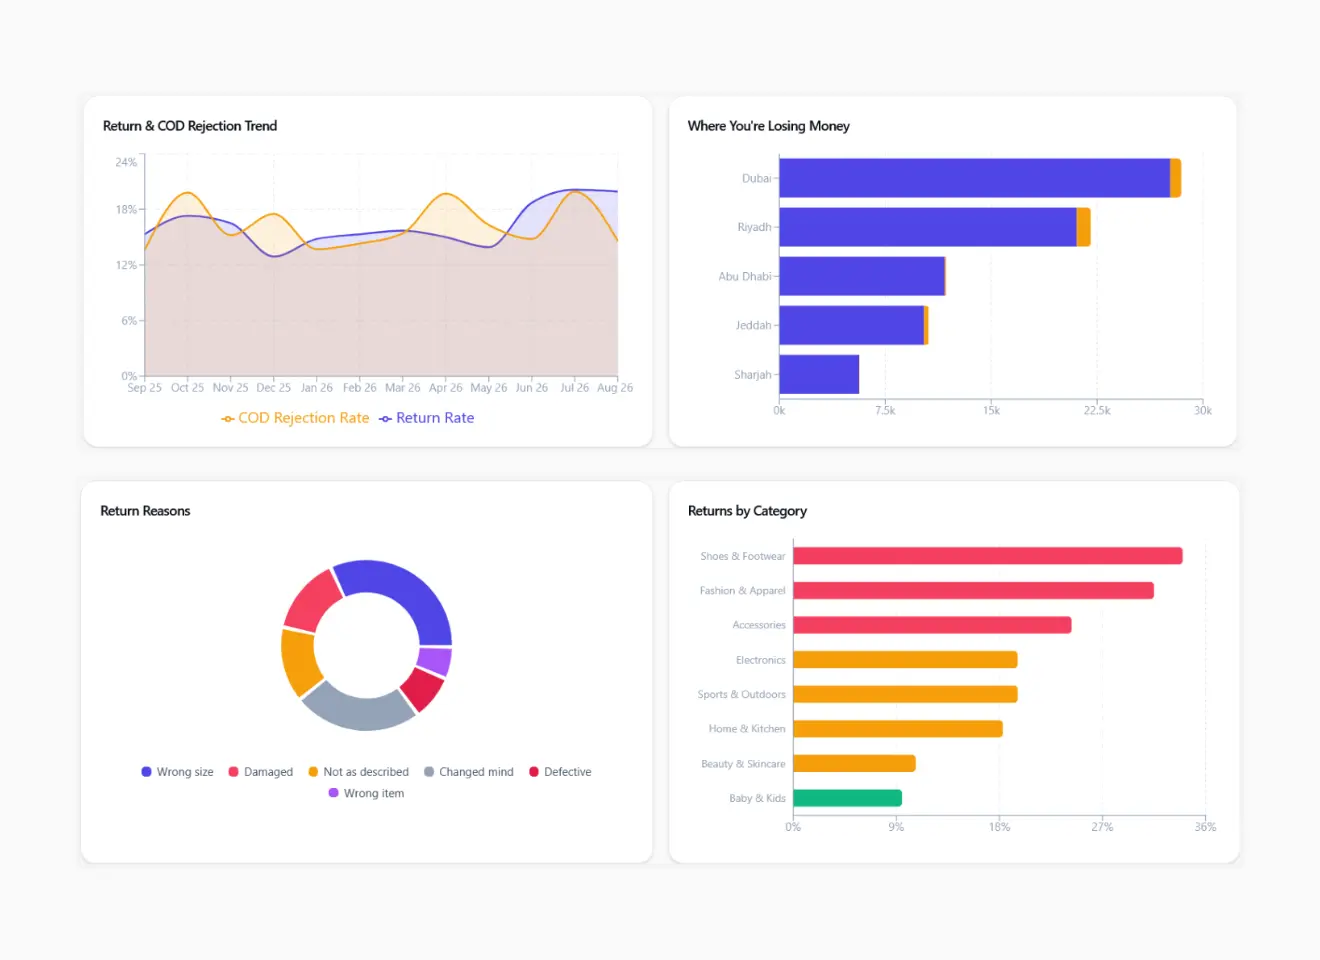
COD success rate by city, rejection reasons, and rejection rate by order value, surfaces exactly where COD is bleeding money, the number one Gulf-specific blind spot most tools ignore.
Return Analytics
Reason breakdown, category, city, and channel comparisons, and return-timing distribution, reframes returns from a cost of doing business into a fixable quality and sizing problem.
Product Risk Analysis
Category heatmap plus a sortable product table with per-SKU return rate, top reason, and total loss, tells the merchandising team exactly which SKUs to fix, re-photograph, or discontinue.
Customer Risk Scoring
0 to 100 score per customer from return rate, COD history, and recent behavior, with a recommended action per tier, identifies the small segment driving disproportionate loss with a clear next step.
AI Recommendations
20 pre-ranked, costed actions plus on-demand generation of new ones from live data, gives a lean ops team the output of a data analyst on demand, without hiring one.
SAR 127,450
Trailing 30-day loss surfaced, split into returns and COD rejections
18% vs 12%
Riyadh COD rejection vs. Gulf average, surfaced automatically at the city level
28% vs 8%
COD rejection rate on orders above SAR 500 vs. smaller orders
SAR 38,000/mo
Estimated recoverable savings across the top three ranked recommendations
Built With